
Trend reports and dashboards your client's auditor can follow
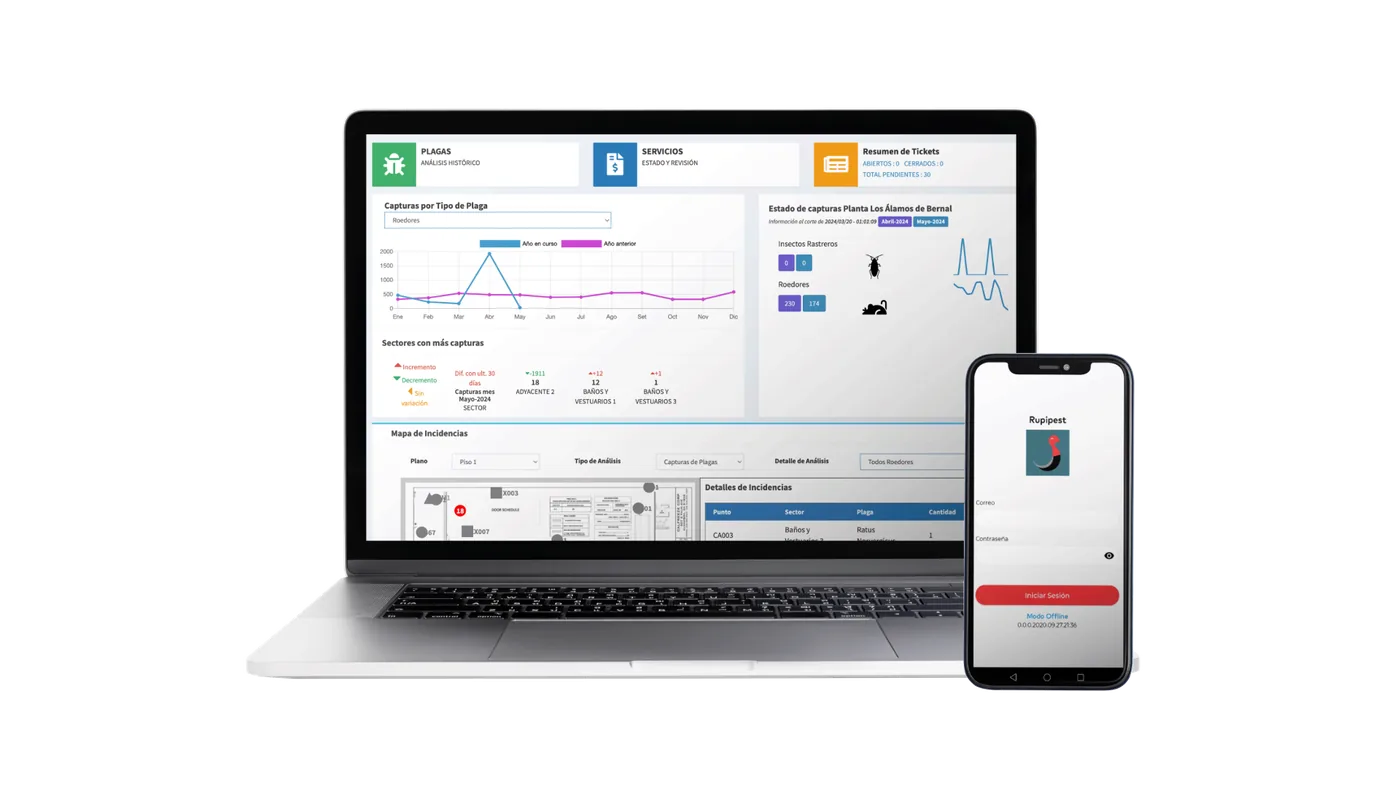
Rupipest shows pest activity by device, by area, by installation, or across all of a client's installations at once, with trend analysis, heat maps, tolerance thresholds and a year-over-year comparison. Every result exports to Excel.
No contract · 30-day money-back guarantee · Office users free on every plan
What it does
- Pest activity by device, area, whole installation or multiple installations
- Trend analysis over time, with year-over-year comparison
- Heat maps of where activity concentrates
- Tolerance thresholds that flag when activity crosses a client's limit
- Export of results to Excel (.xlsx)
What your client sees
Not just a list of visits, but the direction things are moving: which areas are improving, which devices need attention, and how this year compares with last.
Why it mattersAuditors ask what changed and what you did about it. A trend with thresholds answers both before they ask.
Questions
Can a multi-site client see all locations together?
Yes. Activity can be viewed by device, area, installation, or across all of a client's installations.
Can we export the data?
Yes. Results export to Excel (.xlsx).
See it on a setup like yours
A 30-minute demo with Freddy Muro, Rupipest's founder, 9am–9pm Peru time.
Book a demo Choose your planNo contract · 30-day money-back guarantee