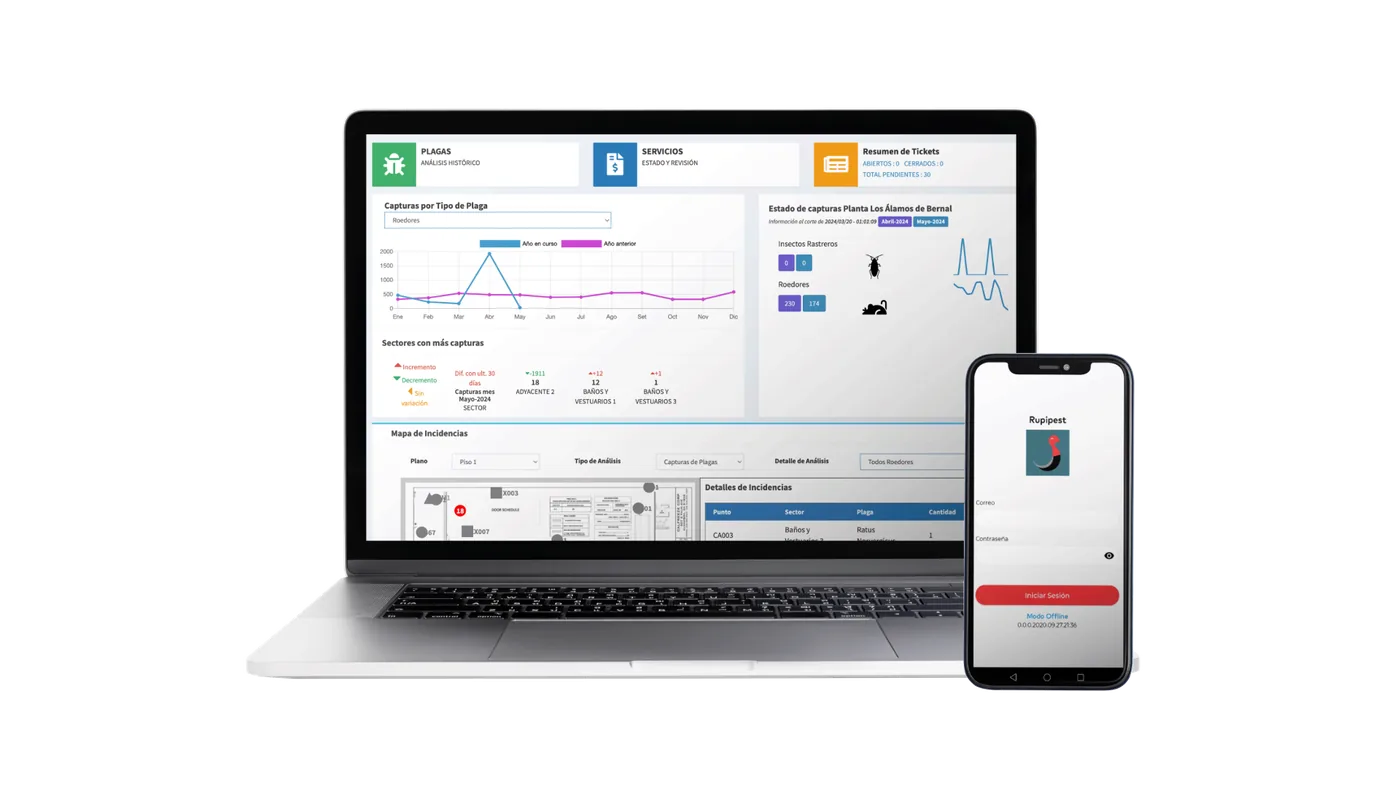
This week we released an improvement for our users. Like every improvement before it (and the ones to come!), it aims to make your life and your clients' lives easier.
Every improvement we design and build comes from user feedback, from the close, trusting relationship our users have with our support team.
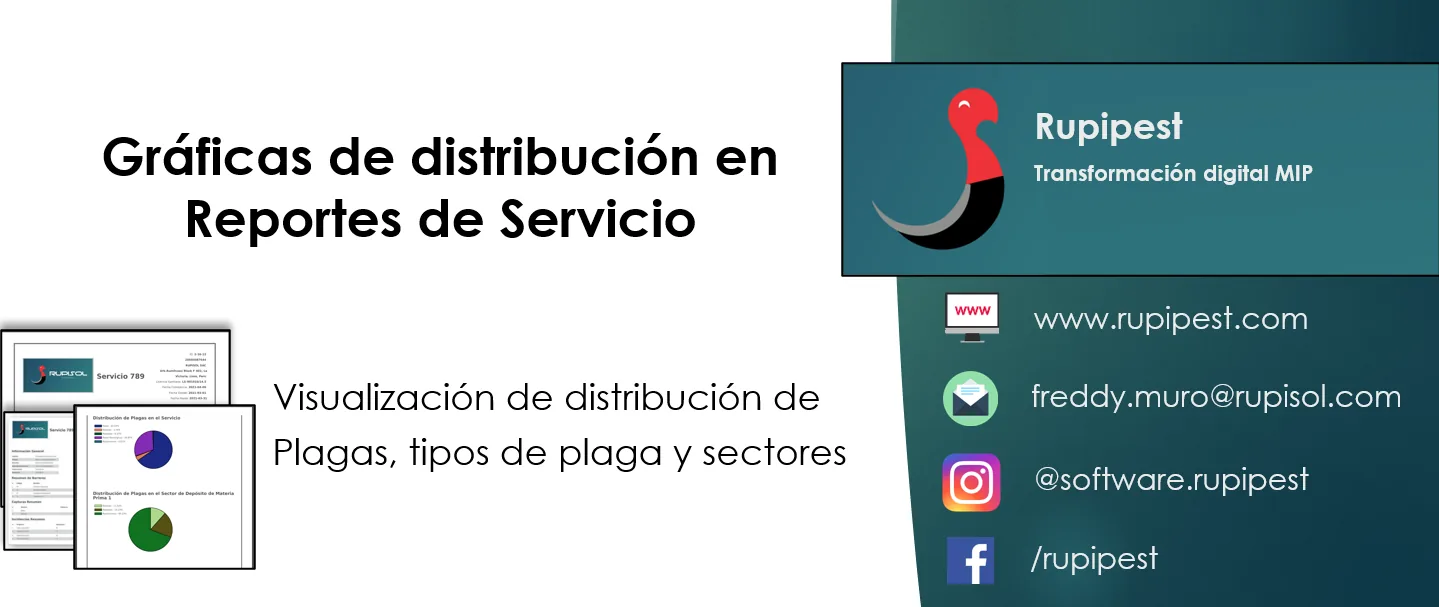
Distribution charts
Rupipest is built to optimize your operations, and one thing that helps a lot is presenting factual, analyzed information so decisions happen faster.
At some point you've probably had to build reports by hand, gathering everything your field team recorded at each control point. It's tedious and repetitive, but necessary.
This improvement goes further in making conclusions automatic. Automating manual work is a deciding factor for companies that want to last and stand out from the competition.
This release includes: distribution of captured pests, pests by pest type and pests by sector.
Watch the demo here (Spanish).